|
查看: 1066|回复: 11
|
急~Help~我需要知道怎样用Python出command~T_T
[复制链接]
|
|
|
我已经install python, installed numpy and scipy.
我是一位初学者。
全都是靠自己学Python.
用它的目的是做学业功课。
请问有谁可以帮帮忙?
谢谢~
另外,可以pm我学Python的网站吗?
我最主要的是要学怎样写出loops or array or sigma summation自类.
这是我求救的Pythin Commands~~
 |
|
|
|
|
|
|
|
|
|
|
|
 发表于 5-3-2008 03:30 AM
|
显示全部楼层
发表于 5-3-2008 03:30 AM
|
显示全部楼层
|
|
|
|
|
|
|
|
|
|
|

楼主 |
发表于 5-3-2008 05:21 PM
|
显示全部楼层
回复 2# Sunyata 的帖子
谢谢你~^_^
不过我怕还是找不到sigma summation 的方法~
有人会吗?
本人感激不尽 |
|
|
|
|
|
|
|
|
|
|
|
发表于 6-3-2008 11:57 AM
|
显示全部楼层
|
|
|
|
|
|
|
|
|
|
|
楼主 |
发表于 6-3-2008 02:26 PM
|
显示全部楼层
回复 4# tensaix2j 的帖子
我只会写C programming的for loops.
难道Python的for loops和 C programming的for loops的command写法是一样的? |
|
|
|
|
|
|
|
|
|
|
|
发表于 6-3-2008 05:26 PM
|
显示全部楼层
原帖由 ~HeBe~_@ 于 6-3-2008 02:26 PM 发表 
我只会写C programming的for loops.
难道Python的for loops和 C programming的for loops的command写法是一样的?
是蠻接近的。
sum=0
for sum in range(10):
sum+=sum
print sum |
|
|
|
|
|
|
|
|
|
|
|
楼主 |
发表于 7-3-2008 12:54 AM
|
显示全部楼层
|
|
|
|
|
|
|
|
|
|
|
发表于 13-3-2008 11:32 AM
|
显示全部楼层
|
|
|
|
|
|
|
|
|
|
|
楼主 |
发表于 13-3-2008 10:09 PM
|
显示全部楼层
回复 8# python_king 的帖子
谢谢你。
若我有个data, data是.txt file,data 里有300 observations (rows).
一个observation(row) 里的1st col有value y 和 2nd col有value theta.\
Exp for nth rows in the data:
0.0 -1.2
0.9 -0.8
1.8 -0.6
2.6 -0.3
3.5 0.1
4.5 0.1
5.4 0.3
6.2 0.5
7.1 0.9
8.0 1.2
8.9 1.3
9.8 1.2
...
...
nth rows
Actually got 300 rows (observation)
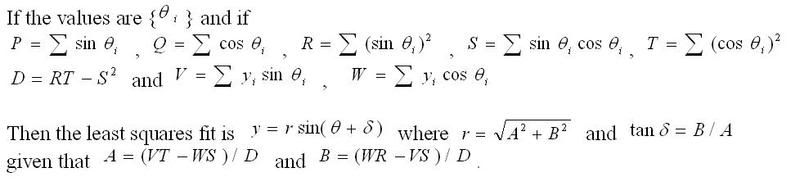
我有一个equation: y = sin (theta) where 我的y value和theta value is given in the data provided.
问题是我read theta 和 y from data.
我已经用split command to split the all rows into 1st col and 2nd col.Then, use all 1st column of all 300 rows substitute into the equation, while use 2nd column of all 300 rows substitute into the equation too.
我要Plot a graph showing the data points as a function of the theta.
要怎样plot graph?
谢谢python_king |
|
|
|
|
|
|
|
|
|
|
|
发表于 14-3-2008 10:37 AM
|
显示全部楼层
|
|
|
|
|
|
|
|
|
|
|
发表于 15-3-2008 03:29 AM
|
显示全部楼层
|
|
|
|
|
|
|
|
|
|
|
楼主 |
发表于 21-3-2008 03:30 PM
|
显示全部楼层
回复 8# python_king 的帖子
谢谢你~^_^
你的website对我有很大的帮助~
 |
|
|
|
|
|
|
|
|
|
| |
 本周最热论坛帖子 本周最热论坛帖子
|


 发表于 5-3-2008 12:03 AM
 变色卡
变色卡 千斤顶
千斤顶


 2100
2100  58
58