|
|
 发表于 5-10-2010 08:08 PM
|
显示全部楼层
发表于 5-10-2010 08:08 PM
|
显示全部楼层
本帖最后由 仙家大炮王 于 5-10-2010 08:20 PM 编辑
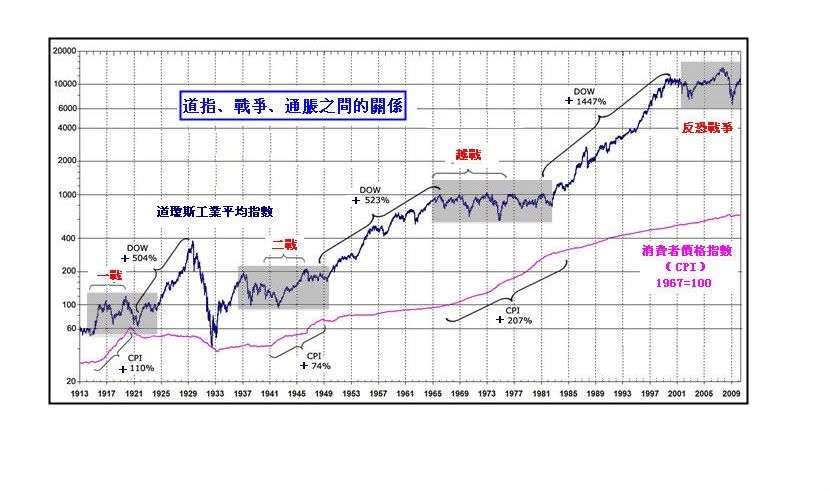
美國道瓊斯指數將在2025年達到38820點。這一來自《股票交易商年鑒》(Stock Trader's Almanac)編輯Jeffrey Hirsch的預言本周引發市場熱議,不少人覺得這個預言荒唐可笑。我們認為如此消極的市場反應正是過去幾年投資者信心急劇下滑的結果。
目前道指在10828點一帶交易,如果其在今年剩餘時間內保持不變的話,那么道指未來每年的年化回報率需要達到8.88%才能實現Jeffrey Hirsch看似大膽的預言。而就在十年前,股票投資者還普遍認為10%的年化回報率是他們“不可剝奪的權利”。現在市場覺得8.88%的年化回報率都有些高不可攀,這恰好說明了市場整體情緒從資本增值到資本保值的巨大轉變。(注:如果按照每年10%的年化回報率計算,道指將在2025年末突破45000點關口。)
下面我們與大家分享一下關於Jeffrey Hirsch作出的道指將步入“下一個超級大牛市週期”觀點的更多內容。如下圖所示,他指出,道指歷史上的幾次超級大牛市週期(累計漲幅大於500%)都有一些共同的作用因素:美國重大戰爭結束後社會重回穩定和繁榮狀態;因戰爭和政府危機開支造成的通貨膨脹;具有革命意義的技術創新。Jeffrey Hirsch表示,美國911事件之後發動了反恐戰爭,股票市場陷入寬幅震盪整理格局,預計這種格局還要持續幾年時間,但道指終究會迎來大牛市行情,因為:(1)反恐戰爭進入尾聲,美國從伊拉克和阿富汗撤軍大局已定;(2)美國政府開支膨脹將令通貨膨脹在未來今年重現;(3)在資源稀缺、人類健康問題凸顯的背景下,能源技術和/或生物技術或將引領社會轉變。Jeffrey Hirsch最後指出,道指在1974年觸及重要底部,但直到八年後的1982年才真正開始騰飛,並於1990年實現了500%的累計漲幅,如果按照這一16年上漲500%的標準推算,那么道指在2009年3月6日觸及6470點重要底部之後,有望在2025年達到38820點。
 |
|
|
|
|
|
|
|
|
|
|
|

楼主 |
发表于 5-10-2010 09:14 PM
|
显示全部楼层
DryShips Inc. (Public, NASDAQ:DRYS)

注:图表分析使用最后交易日: 10月4日 |
|
|
|
|
|
|
|
|
|
|
|
楼主 |
发表于 5-10-2010 09:25 PM
|
显示全部楼层
Allied Irish Banks, plc. (ADR) (Public, NYSE:AIB)
本帖最后由 daniel888 于 5-10-2010 09:28 PM 编辑

注:图表分析使用最后交易日: 10月4日 |
|
|
|
|
|
|
|
|
|
|
|
楼主 |
发表于 5-10-2010 09:55 PM
|
显示全部楼层
Dell Inc. (Public, NASDAQ:DELL)

注:图表分析使用最后交易日: 10月4日 |
|
|
|
|
|
|
|
|
|
|
|
楼主 |
发表于 5-10-2010 11:28 PM
|
显示全部楼层
Samson Oil & Gas Limited (ADR) (Public, AMEX:SSN)
本帖最后由 daniel888 于 5-10-2010 11:47 PM 编辑

注:图表分析使用最后交易日: 10月4日
Key Data Indicators for Samson Oil & Gas Limited (SSN)
Published on 10/04/2010 by Leo Goldman
NEW YORK (Market Intellisearch) -- In today's trading session, the shares of Samson Oil & Gas Limited crossed below the 50-day moving average indicating a likely bearish trend. Recent activity signals that the shares may continue to head lower in the foreseeable future assuming that the moving average continues to rise with the price of the equity. Shares of SSN settled the day down $0.07 to $1.26 on lighter than usual volume. Today, the stock price ranged between $1.25 and $1.32. The stock's 52 week low is 0.1 and the 52 week high is 1.50.
Investor expectations change with time, and they often do so abruptly. The development of resistance levels is probably the most noticeable and reoccurring event on price charts. The breaking through resistance levels can be triggered by fundamental changes that are above or below investor's expectations. Based on the pivot points, the current support and resistance levels for SSN are 1.23 and 1.30 respectively. If the support point price is broken in an downward movement, then the bearish trend is likely to continue and vice versa.
http://www.marketintellisearch.com/articles/1058066.html |
|
|
|
|
|
|
|
|
|
|
|
发表于 6-10-2010 09:37 AM
|
显示全部楼层
注:图表分析使用最后交易日: 10月4日
Key Data Indicators for Samson Oil & Gas Limited (SSN)
P ...
daniel888 发表于 5-10-2010 11:28 PM 
感恩。 
小弟,謝謝分享。 |
|
|
|
|
|
|
|
|
|
| |
 本周最热论坛帖子 本周最热论坛帖子
|


 2123
2123  110
110